So you want to be a data scientist? That’s fantastic! As a data scientist, you’ll have the opportunity to solve real-world problems using your analytical and programming skills. But with the field of data science constantly evolving, it’s essential to stay ahead of the curve and equip yourself with the most effective tools.
In the world of data science, Python reigns supreme, offering a versatile programming language with a rich ecosystem of libraries specifically designed for data analysis, machine learning, and visualization.
To guide you on your journey to becoming a data scientist, I’ve compiled a list of six Python libraries that are absolutely essential to master in 2025. These libraries form the foundation for most data science tasks and will empower you to tackle any challenge that comes your way.
1. NumPy:

NumPy (Numerical Python) is the cornerstone of numerical computing in Python. It provides the fundamental building blocks for many other Python libraries in the data science ecosystem, including Pandas and Scikit-learn. NumPy introduces powerful tools for working with arrays and matrices, which are essential data structures for handling the numerical data that forms the basis of data science.
Use Cases
NumPy’s applications in data science are vast and varied. Here are some of the key areas where NumPy shines:
- Mathematical and statistical operations: NumPy provides a comprehensive set of functions for performing mathematical and statistical operations on arrays and matrices. This includes basic arithmetic, linear algebra, Fourier transforms, random number generation, and more.
- Linear algebra: NumPy has powerful tools for linear algebra, which is a fundamental component of many machine learning algorithms.
- Image processing: Images can be represented as multi-dimensional arrays, making NumPy a valuable tool for image processing tasks such as image manipulation, filtering, and analysis.
- Signal processing: NumPy is used in signal processing applications for tasks such as filtering, Fourier analysis, and time-domain analysis.
- Game development: NumPy can be applied in game development for tasks like physics simulations, collision detection, and handling large datasets representing game assets.
Advantages
NumPy offers several advantages that make it a cornerstone of the Python data science ecosystem:
- Efficiency: NumPy arrays are stored in contiguous blocks of memory, making them more memory-efficient and faster to process than Python lists. This efficiency is crucial when working with large datasets or performing complex computations.
- Broadcasting: NumPy allows operations between arrays of different shapes and sizes through broadcasting. This feature simplifies code and eliminates the need for explicit loops, making your code more concise and readable.
- Vectorization: NumPy supports vectorized operations, allowing you to perform operations on entire arrays at once. This is significantly faster than iterating through individual elements, especially for large datasets.
- Speed: NumPy’s code is primarily written in C, a compiled language known for its speed and efficiency. This contributes to NumPy’s impressive performance, especially when compared to interpreted languages like Python.
Disadvantages
While NumPy is a powerful library, it’s important to be aware of its limitations:
- Homogeneous data types: NumPy arrays typically hold elements of the same data type. This can be restrictive when dealing with mixed data types, such as combining numerical and textual data within the same array. However, NumPy does offer structured arrays, which can hold elements of different data types, providing a solution for this limitation.
- Limited GPU support: NumPy operations are primarily CPU-bound. While NumPy can be used with GPUs through libraries like CuPy or Numba, it doesn’t offer native GPU support. This can be a limitation for deep learning tasks that could benefit from parallel processing on GPUs.
Community Support
NumPy boasts a large and active community of users and contributors who are dedicated to its development and support. This vibrant community ensures that NumPy remains a robust and reliable tool for data scientists. You can find extensive documentation, tutorials, and help on the NumPy website, mailing lists, and various online forums like Stack Overflow. The community also organizes events, meetups, and conferences to foster collaboration and knowledge sharing.
Future Outlook
NumPy is a cornerstone of the scientific Python ecosystem and is expected to continue playing a vital role in data science for years to come. Future development focuses on several key areas:
- Interoperability: NumPy aims to improve interoperability with other array libraries, enabling seamless data exchange and collaboration between different tools.
- Performance: Ongoing efforts are dedicated to enhancing NumPy’s performance, making it even faster and more efficient for numerical computations.
- Hardware support: NumPy is expanding its support for different hardware architectures, including GPUs and other specialized processors, to cater to the evolving needs of data scientists.
Learning Resources
- Online Courses:
- Online Tutorials:
NumPy’s efficient array operations are not only essential for numerical computations but also serve as the foundation for many other Python libraries in the data science ecosystem. By mastering NumPy, you’ll gain a solid understanding of the underlying principles that power many data science tools and techniques.
2. Pandas:
Pandas is an indispensable library for data manipulation and analysis in Python. It provides powerful and intuitive data structures, such as DataFrames, which are essentially tables with rows and columns. This makes it incredibly easy to work with structured data, whether it’s from spreadsheets, CSV files, or SQL databases.
Use Cases
Pandas is a versatile tool that can be applied to a wide range of data science tasks:
- Data cleaning and preprocessing: Pandas provides a comprehensive toolkit for data cleaning and preprocessing. You can use it to handle missing data, remove duplicates, transform data types, and prepare your data for analysis.
- Exploratory data analysis (EDA): Pandas simplifies exploratory data analysis by allowing you to easily calculate summary statistics, filter data based on conditions, and create visualizations to understand your data’s structure and patterns.
- Data wrangling: Pandas excels at data wrangling tasks, such as merging, joining, and reshaping datasets. This makes it easy to combine data from different sources and transform it into a format suitable for analysis.
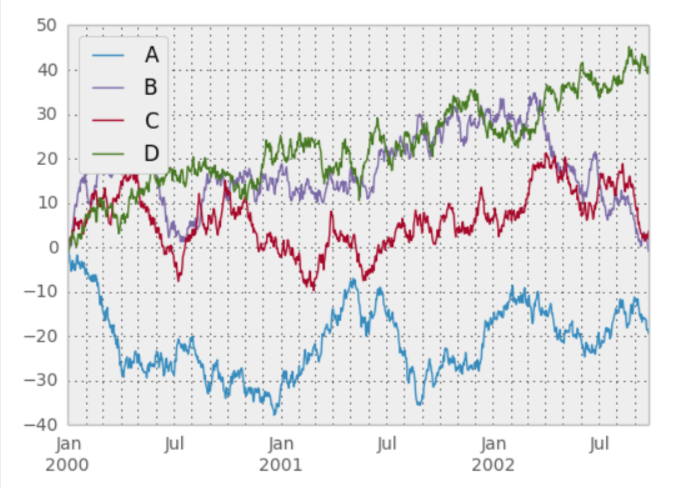
- Time series analysis: Pandas has built-in support for handling time series data, making it easy to work with dates, times, and time-indexed data. You can use it to analyze stock prices, weather patterns, or any data that changes over time.
- Web scraping: Pandas can be used to extract data from websites and clean and transform web data, making it a valuable tool for data acquisition and preparation.
Advantages
Pandas offers several advantages that make it a favorite among data scientists:
- Pandas’ DataFrames provide a familiar and intuitive way to work with structured data, similar to spreadsheets or SQL tables. This makes it easy to understand and manipulate data.
- Pandas is built on top of NumPy, allowing it to leverage NumPy’s efficient array operations for faster data processing. This makes Pandas a powerful tool for handling large datasets.
- Pandas supports reading and writing data in various formats, including CSV, Excel, SQL databases, HDF5, JSON, and more. This makes it easy to import and export data from different sources.
Disadvantages
While Pandas is a versatile library, it’s important to be aware of its limitations:
- Memory limitations: Pandas loads entire datasets into memory, which can be problematic for very large datasets that exceed available RAM. For such cases, consider using alternative libraries like Dask or PySpark, which are designed for distributed computing and can handle larger-than-memory datasets.
- Limited support for unstructured data: Pandas is primarily designed for structured data and may not be the best choice for handling unstructured or semi-structured data, such as text documents or social media posts.
Community Support
Pandas has a large and active community of users and contributors, providing extensive documentation, tutorials, and support. You can find help on the Pandas website, Stack Overflow, and other online forums. The community also organizes events and conferences to foster collaboration and knowledge sharing.
Future Outlook
Pandas is an essential library for data science and is expected to remain so in the future. Future development focuses on improving performance, enhancing support for different data sources, and expanding its capabilities for handling large datasets.
Learning Resources
To get started with Pandas, check out these resources:
- Online Courses:
- Online Tutorials:
- pandas cookbook by Julia Evans
- Pandas workshop by Stefanie Molin
- Python pandas Tutorial: The Ultimate Guide for Beginners (DataCamp)
- Pandas Tutorial (GeeksforGeeks)
Pandas is a versatile library that can handle various data manipulation tasks, from cleaning and preprocessing to merging and reshaping. Its intuitive data structures and efficient operations make it an essential tool for any data scientist working with structured data.
3. Matplotlib:
Matplotlib is the classic plotting library in Python, providing a wide range of plotting functions for creating static, animated, and interactive visualizations. It’s the most widely used plotting library in the Python ecosystem and has been a staple for data visualization for many years.
Use Cases
Matplotlib is a versatile tool for creating various types of visualizations:
- Line plots: Visualizing trends and patterns in data over time or any continuous variable.
- Scatter plots: Displaying relationships or correlations between two variables.
- Bar charts: Comparing quantities across different categories or groups.
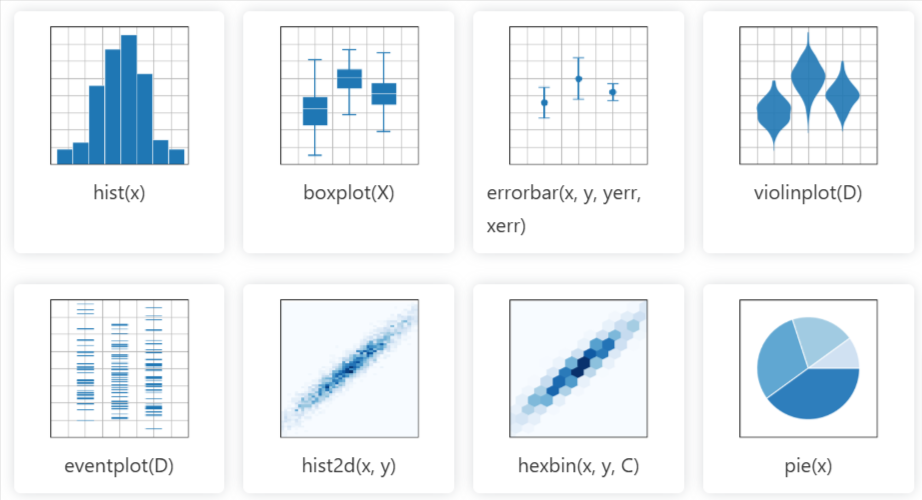
- Histograms: Visualizing the distribution of a dataset.
- Pie charts: Showing the proportions of different categories in a dataset.
- Geospatial data visualization: Creating maps and visualizing geospatial data using the
basemaptoolkit.
Advantages
Matplotlib offers several advantages that make it a popular choice for data visualization:
- Matplotlib supports a wide range of plot types and customization options, allowing you to create visualizations that precisely meet your needs.
- Matplotlib can create high-quality plots suitable for publication in academic papers, reports, and presentations. You have fine-grained control over every aspect of the plot, from colors and fonts to labels and annotations.
- Matplotlib integrates well with other Python libraries like NumPy and Pandas, making it easy to create visualizations from data stored in these libraries.
- Matplotlib can create interactive figures that can zoom, pan, and update. This allows users to explore data in more detail and interact with visualizations dynamically.
Disadvantages
While Matplotlib is a powerful library, it’s important to be aware of its limitations:
- Matplotlib can be complex to use for beginners, especially for creating customized or complex visualizations. Its extensive customization options can be overwhelming, and the API can be less intuitive than some newer libraries.
- While Matplotlib can create interactive plots, its primary focus is on static visualizations. For more advanced interactivity, consider using libraries like Plotly or Bokeh.
Community Support
Matplotlib has a large and active community of users and contributors, providing extensive documentation, tutorials, and support. You can find help on the Matplotlib website, mailing lists, Stack Overflow, and other online forums. The community also organizes events and conferences to foster collaboration and knowledge sharing.
Future Outlook
Matplotlib remains a popular choice for data visualization in Python and is expected to continue evolving with new features and improvements. Future development focuses on several key areas:
- Enhanced interactivity: Matplotlib is working on improving its interactive capabilities, making it easier to create dynamic and engaging visualizations.
- 3D plotting: Matplotlib is enhancing its 3D plotting capabilities, providing more options and flexibility for visualizing three-dimensional data.
- Simplified API: Matplotlib is working on simplifying its API to make it more user-friendly and accessible to beginners.
Learning Resources
To get started with Matplotlib, check out these resources:
- Online Courses:
- Online Tutorials:
Matplotlib’s extensive customization options make it a powerful tool for creating publication-quality plots, but also contribute to its complexity. By mastering Matplotlib, you’ll gain the ability to create highly customized and visually appealing visualizations.
4. Seaborn:

Seaborn is a data visualization library built on top of Matplotlib. It provides a high-level interface for creating informative and attractive statistical graphics. Seaborn simplifies the process of creating complex visualizations by providing a set of pre-defined functions that allow you to generate various plot types quickly and with minimal code.
Use Cases
Seaborn is particularly well-suited for visualizing various aspects of your data:
- Distributions: Create histograms, kernel density plots, and cumulative distribution functions to visualize the distribution of your data.
- Relationships: Explore relationships between variables using scatter plots, line plots, and regression plots.
- Comparisons: Compare data across different categories or groups using bar plots, box plots, and violin plots.
- Categorical data: Visualize categorical data using count plots, swarm plots, and strip plots.
- Visualizing the distribution of data across different categories: Utilize violin plots to gain a deeper understanding of how data is distributed within various categories.
Advantages
Seaborn offers several advantages that make it a valuable tool for data visualization:
- Seaborn simplifies the creation of complex statistical visualizations with a more concise and intuitive syntax than Matplotlib. This makes it easier to generate informative plots with less code.
- Seaborn comes with built-in themes and color palettes that make it easy to create visually appealing plots. These themes are designed to be aesthetically pleasing while maintaining clarity and readability.
- Seaborn is specifically designed for visualizing statistical relationships and distributions, providing specialized plot types for this purpose. This makes it a powerful tool for data exploration and understanding.
- Seaborn can automatically perform statistical estimation, such as calculating confidence intervals and drawing error bars, to enhance your visualizations with statistical information.
Disadvantages
While Seaborn offers many benefits, it’s important to be aware of its limitations:
- While Seaborn provides a high-level interface, it may offer less flexibility for customization compared to Matplotlib. For highly customized plots, you might need to use Matplotlib directly.
- Seaborn is built on top of Matplotlib, so you still need to have some familiarity with Matplotlib for more advanced customization.
Community Support
Seaborn has a growing community of users and contributors, providing documentation, tutorials, and support. You can find help on the Seaborn website, Stack Overflow, and other online forums.
Future Outlook
Seaborn is a valuable tool for data visualization and is expected to continue gaining popularity. Future development focuses on improving integration with other libraries, expanding plot types, and enhancing interactivity.
Learning Resources
To get started with Seaborn, check out these resources:
- Online Courses:
- Online Tutorials:
Seaborn’s focus on statistical visualization makes it a valuable tool for data exploration and understanding. Its ease of use and attractive aesthetics make it a great choice for creating informative and visually appealing statistical graphics.
5. Scikit-learn:
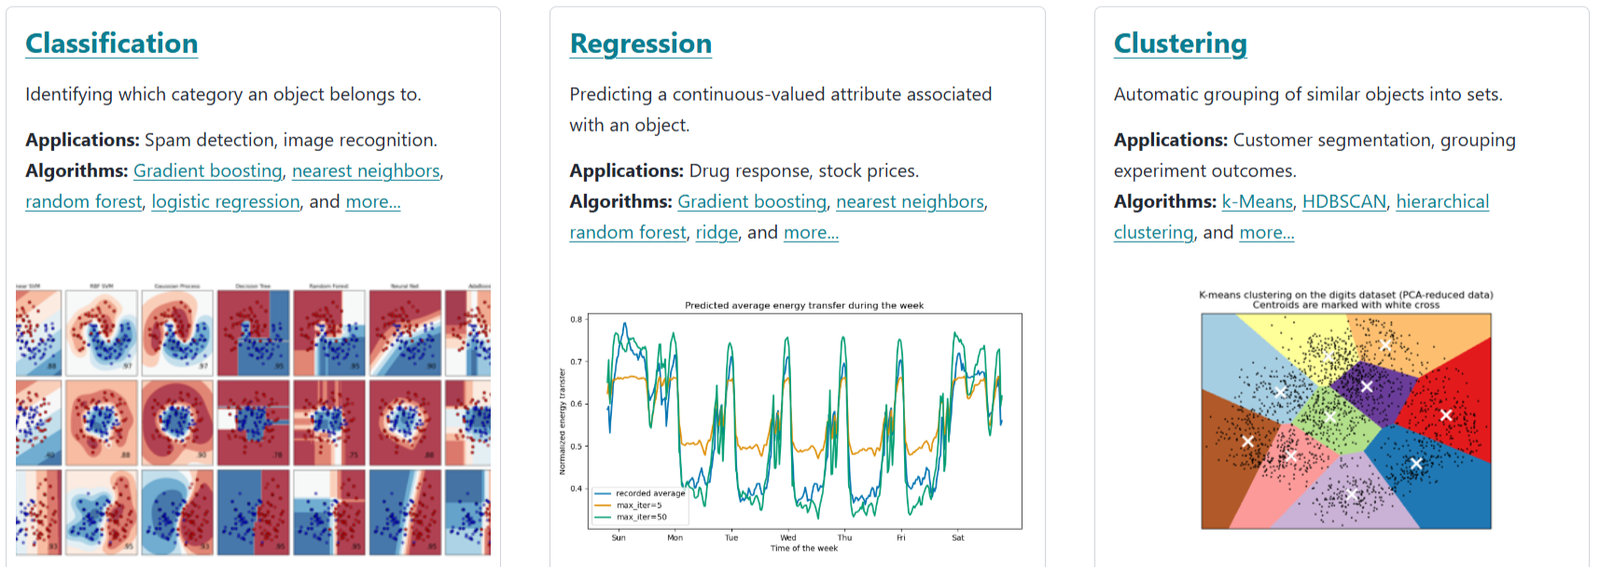
Scikit-learn is the most popular machine learning library in Python. It provides a wide range of algorithms for classification, regression, clustering, dimensionality reduction, model selection, and preprocessing. Scikit-learn is built on top of NumPy, SciPy, and Matplotlib, making it a powerful and versatile tool for machine learning tasks.
Use Cases
Scikit-learn is used extensively in various machine learning tasks, including:
- Predictive modeling: Building models to predict future outcomes, such as customer churn, stock prices, or disease risk.
- Classification: Assigning data points to different categories, such as spam detection, image recognition, or sentiment analysis.
- Clustering: Grouping similar data points together, such as customer segmentation, anomaly detection, or document clustering.
- Image classification: Classifying images into different categories, such as recognizing handwritten digits or identifying objects in images.
- Feature extraction: Extracting features from text and images to prepare data for machine learning models.
Advantages
Scikit-learn offers several advantages that make it a popular choice for machine learning:
- Scikit-learn provides a wide range of algorithms for various machine learning tasks, covering both supervised and unsupervised learning.
- Scikit-learn has a consistent and user-friendly API, making it easy to use and switch between different algorithms. This simplifies the process of building and experimenting with different machine learning models.
- Scikit-learn has excellent documentation with examples and tutorials, making it easy to learn and use the library effectively.
Disadvantages
While Scikit-learn is a powerful library, it’s important to be aware of its limitations:
- While scikit-learn provides some neural network models, it is not primarily focused on deep learning. For more advanced deep learning tasks, consider using libraries like TensorFlow, Keras, or PyTorch.
- Scikit-learn may not be the best choice for very large datasets or complex deep learning models that require specialized hardware like GPUs. For such cases, consider using libraries like Dask or PySpark, which are designed for distributed computing.
Community Support
Scikit-learn has a large and active community of users and contributors, providing extensive documentation, tutorials, and support. You can find help on the Scikit-learn website, mailing lists, Stack Overflow, and other online forums. The community also organizes events and conferences to foster collaboration and knowledge sharing.
Future Outlook
Scikit-learn remains a central library for machine learning in Python and is expected to continue evolving with new algorithms, improved performance, and better support for deep learning and large datasets.
Learning Resources
To get started with Scikit-learn, check out these resources:
- Online Courses:
- Online Tutorials:
Scikit-learn’s comprehensive algorithms cover a wide range of machine learning tasks, from classification and regression to clustering and dimensionality reduction. Its simple interface and extensive documentation make it an excellent choice for both beginners and experienced data scientists.
6. Plotly:
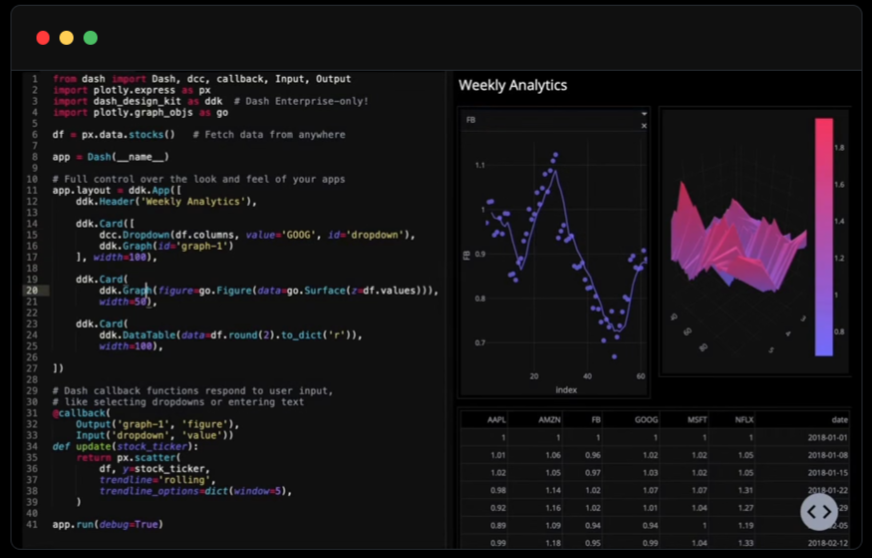
Plotly is a powerful library for creating interactive visualizations that can be displayed in web browsers. It provides a wide range of chart types and customization options, making it ideal for creating dashboards, presentations, and interactive web applications. Plotly’s visualizations are built on top of the Plotly JavaScript library (plotly.js), enabling dynamic and engaging visual experiences.
Use Cases
Plotly is a versatile tool for creating various types of interactive visualizations:
- Dashboards: Creating interactive dashboards for data exploration, monitoring, and business intelligence applications.
- Presentations: Building engaging presentations with dynamic visualizations that captivate your audience.
- Web applications: Integrating interactive charts and graphs into web applications to enhance data visualization and user experience.
- Real-time data visualization: Creating interactive dashboards for monitoring real-time data, such as financial markets or sensor data.
Advantages
Plotly offers several advantages that make it a popular choice for interactive visualizations:
- Interactivity: Plotly’s key strength is its ability to create interactive visualizations that allow users to zoom, pan, hover, and explore data in more detail. This interactivity enhances data exploration and engagement.
- Visual appeal: Plotly creates visually appealing and modern-looking visualizations with minimal effort. Its default themes and styling options make it easy to generate attractive plots.
- Web integration: Plotly is designed for web integration, making it easy to embed interactive charts and graphs into web applications and dashboards.
- Variety of chart types: Plotly supports a wide range of chart types, including basic charts like line charts and scatter plots, as well as more specialized charts like 3D charts, maps, and statistical charts.
Disadvantages
While Plotly offers many benefits, it’s important to be aware of its limitations:
- Performance with large datasets: Interactive rendering in a browser may lag with very large datasets. While Plotly provides optimization techniques, performance can be a concern when dealing with massive datasets or complex visualizations.
- Learning curve: While Plotly is easy to use for basic plots, mastering its full capabilities, especially for advanced customization or complex layouts, can take time and effort.
Community Support
Plotly has a growing community of users and contributors, providing documentation, tutorials, and support. You can find help on the Plotly community forum, GitHub, and other online resources. The community also organizes events and meetups to foster collaboration and knowledge sharing.
Future Outlook
Plotly is a cutting-edge library for interactive visualizations and is expected to continue gaining popularity. Future development focuses on improving performance, expanding chart types, and enhancing integration with other tools and frameworks.
Learning Resources
To get started with Plotly, check out these resources:
- Online Courses:
- Online Tutorials:
Plotly’s interactivity makes it a powerful tool for engaging audiences and enabling data exploration, but can also lead to performance issues with very large datasets. By mastering Plotly, you’ll be able to create dynamic and visually appealing visualizations that bring your data to life.
Other Essential Tools
While the six libraries mentioned above are crucial for data scientists, there are other valuable tools worth exploring:
- Pygwalker: This low-code visualization library built on top of Pandas simplifies data exploration for both technical and non-technical users. Its drag-and-drop interface allows you to quickly create interactive dashboards from Pandas DataFrames.
- Apache Superset: This data exploration and visualization platform can be used by users with no technical background. It provides a user-friendly interface for exploring data, creating charts, and building dashboards, democratizing data access and visualization.
- Deep learning libraries: Python offers various deep learning libraries, such as TensorFlow, Keras, PyTorch, and FastAI. These libraries provide tools for building and training neural networks, which are essential for tasks like image recognition, natural language processing, and more.
Conclusion
These six Python libraries—NumPy, Pandas, Matplotlib, Seaborn, Scikit-learn, and Plotly—form a powerful toolkit for any aspiring data scientist. By mastering these libraries, you’ll be well-equipped to handle a wide range of data science tasks, from data cleaning and preprocessing to machine learning and interactive visualization.
These libraries are not isolated tools but rather interconnected components of a broader data science workflow. NumPy provides the foundation for numerical computing, Pandas excels at data manipulation, Matplotlib and Seaborn enable visualization, and Scikit-learn powers machine learning. Plotly adds interactivity and web integration to your visualizations.
Remember that continuous learning is key. The field of data science is constantly evolving, with new libraries and tools emerging regularly. Embrace the challenge, explore new technologies, and never stop learning.